Continued thread

By popular demand, here's a map showing the Netto Marken-Discount / Netto distribution within Germany.


By popular demand, here's a map showing the Netto Marken-Discount / Netto distribution within Germany.
Was bored on my way to #eh22 and made a map showing the ALDI Nord / ALDI Süd distribution within Germany using Overpass-Ultra and #OpenStreetMap data.

@owiecc This is an example #OverpassTurbo query I use. It looks in a geocoded area, but you can modify it for a bounding box. Similarly, change the date in newer to fit your use-case. https://overpass-turbo.eu/s/22hj
Trying to export some data from #OverpassTurbo. But it will only export nodes, not ways. I've tried both gpx and geojson. I can't see any settings/options for selecting what kind of data to export. Help?
Alrighty. Several hours later, and I have Tarrant County's updated early voting locations :D
Overpass-turbo query: https://overpass-turbo.eu/s/21qx
Actual location info from county (can match up the numbers on the map to addresses): https://www.tarrantcountytx.gov/content/dam/main/elections/2025/0525/locations/0525_EV_Sched.pdf
And a reddit post in the FortWorth subreddit: https://www.reddit.com/r/FortWorth/comments/1jorg38/early_voting_locations_for_april_2025/
#reddit #pdf #OverpassTurbo #OSM #OpenStreetMap #OpenData #FortWorth #Tarrant #dfw #txpol #uspol
So far, I only have locations that serve (at least) as early voting centers. There are several more pages of day-of voting centers that I could conceivably add. I'm debating building a small, static, mobile website with #Leaflet to perhaps make a "show me my closest voting station" feature, and maybe a "schedule my voting time" feature that spits out an ical file or something. The opening hours are all there in the OSM data.
(Annoying sidenote: most college/university locations are either early vote only, election day only, or not open at all :()
. All of Tarrant county is visible, with yellow dots accompanied by numbers. The numbers can be cross-referenced to the county's list of early voting centers to get addresses.")
Want to create a time series animation like the one @bmacs001 posted, but for your favorite region? The #OSMWiki has the rudiments of a guide to creating one with {#OverpassTurbo or #OverpassUltra or #QLever} + #QGIS + #FFmpeg:
Ich bin gestern kläglich gescheitert, beim Versuch mir die Stadtgrenze von München in #Bikerouter anzeigen zu lassen.. 
Vermutlich bin ich zu doof für die Syntax von #OverpassTurbo aber andererseits sollte das doch auch viel einfacher gehen, wenn es nur um eine fixe Relation geht:
https://www.openstreetmap.org/relation/62428
@mjaschen evtl. ein Tipp? Anzeige oder womöglich als Vermeidung einrichten?
Getting data from #OpenStreetMap for analysis in #QGIS is both easy and tricky.
For individual items, try the #OSMInfo plugin. Need small extracts? #OverpassTurbo works well.
But what if you need all supermarkets or hotels worldwide? What's your go-to method? Let's discuss! 

If you’ve been querying our data using https://openhistoricalmap.github.io/overpass-turbo/ , please note that this is a development version of the site that is subject to occasional instability or bugs. The official instance of #OverpassTurbo is at https://overpass-turbo.openhistoricalmap.org/ For more powerful visualizations, you can also use #OverpassUltra at https://ohm.overpass-ultra.us/
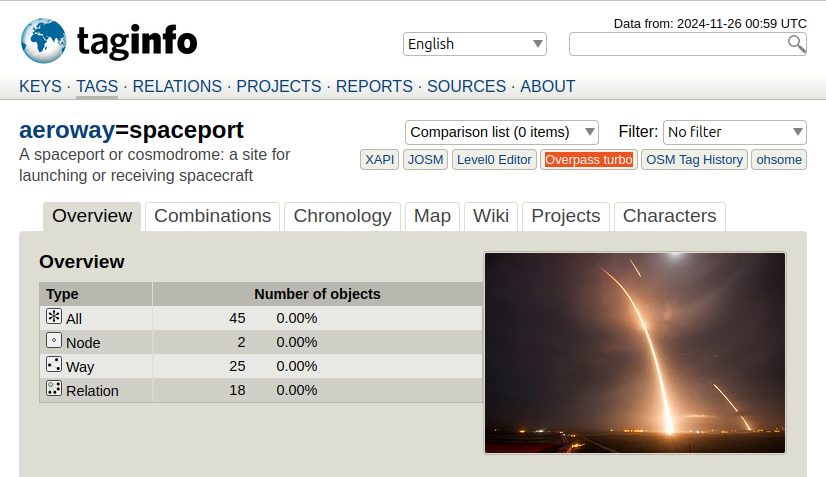
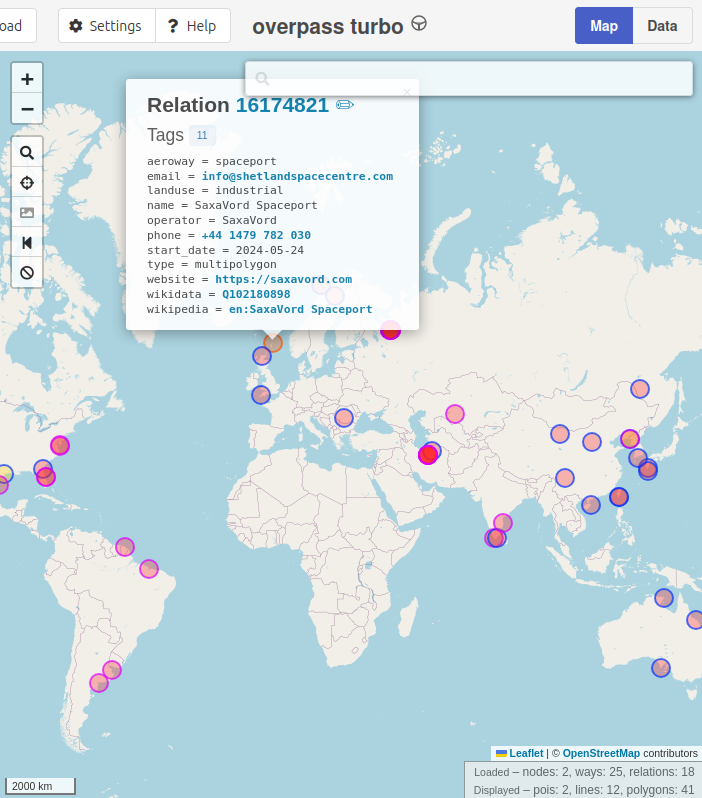
For details about the #spaceports, use #OverpassTurbo https://taginfo.openstreetmap.org/tags/aeroway=spaceport  https://overpass-turbo.eu/?w=%22aeroway%22%3D%22spaceport%22+global&R
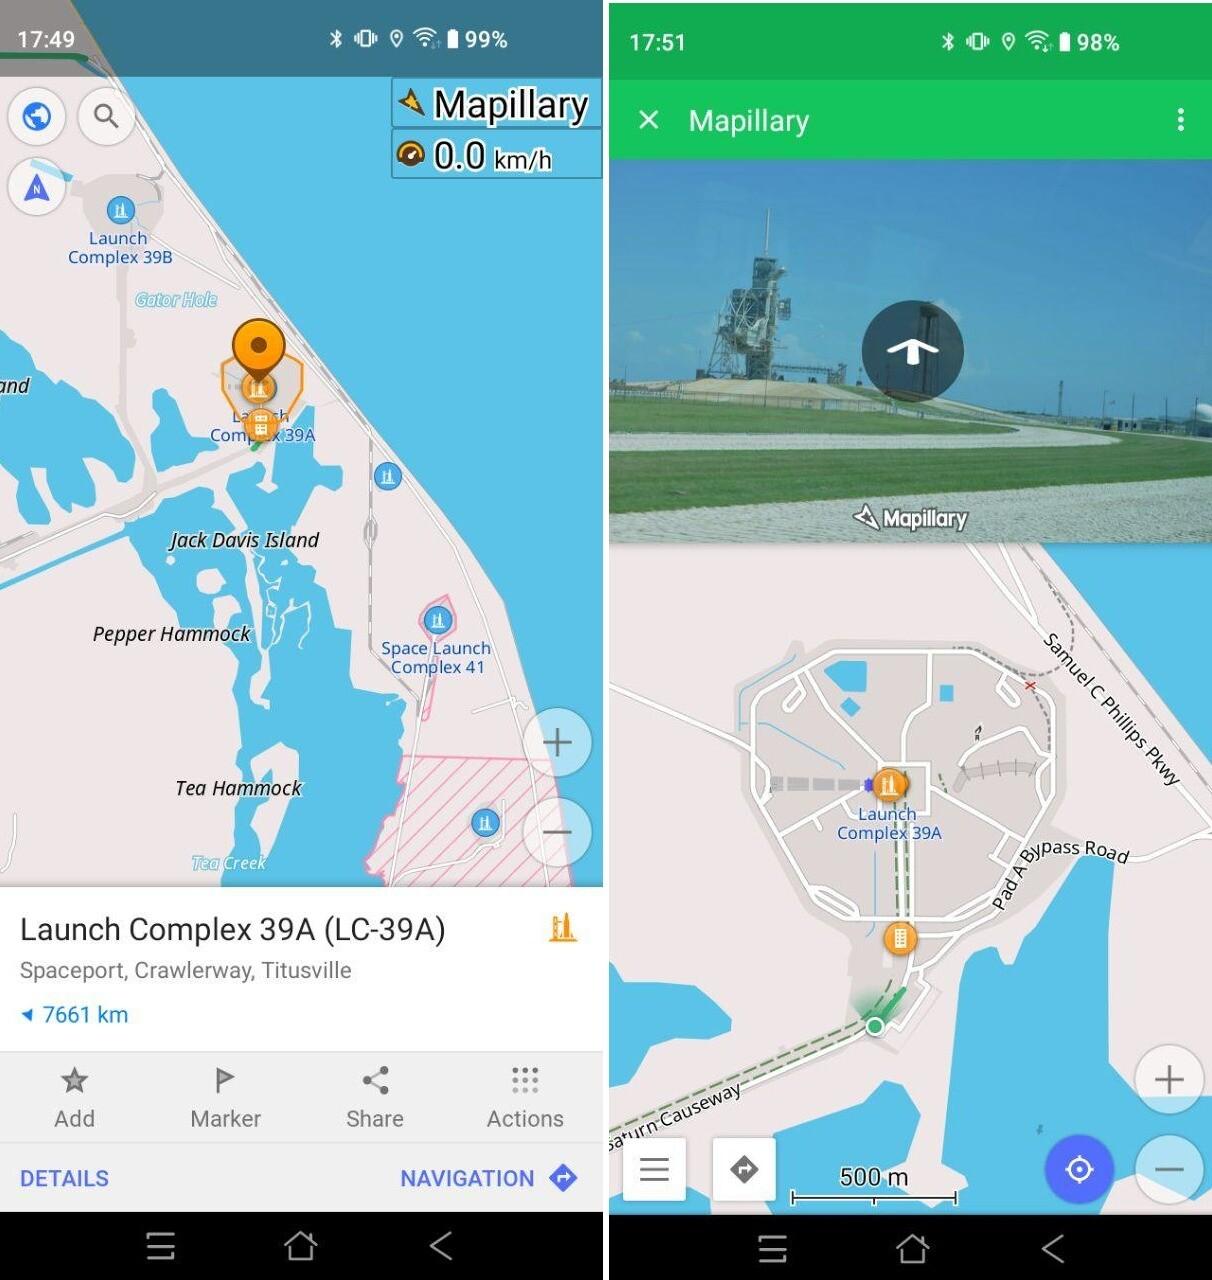
...or #OsmAnd on your #mobilephone  (got them as #POI) https://f-droid.org/en/packages/net.osmand.plus/index.html
The Bing ML buildings data is from this GitHub repo and first released in 2022: https://github.com/microsoft/IdMyPhBuildingFootprints
I used the following tools/services:
▪︎ @geofabrik for the OSM buildings
▪︎ #OverpassTurbo for extracting clipping polygons from OSM
▪︎ Osmosis for filtering the OSM buildings
▪︎ @qgis #QGIS for GeoJSON clipping and data conversion
▪︎ A couple of hand-coded Perl scripts for data manipulation
▪︎ #TurfJS
▪︎ #LeafletJS for rendering
▪︎ H3 for hexbinning
▪︎ @GIMP #GIMP for final map prep
 3/4
3/4
Data and image sources:
▪︎ #OpenStreetMap (ODbL 1.0) for the basemap (via CARTO Positron) and diocese boundaries
▪︎ #Wikidata (CC0) for the cathedral coordinates
▪︎ #Mozilla (CC BY 4.0) for the church icon
▪︎ Diocesan coats-of-arms from https://commons.wikimedia.org/wiki/Category:Coats_of_arms_of_dioceses_of_the_Philippines
Tools used:
▪︎ #OverpassTurbo for extracting OSM data
▪︎ HTML5 + #Leaflet for map rendering
▪︎ #GIMP for final composing and labels
2/2
@Incognitim Don't wanna wait for Tarrant County to upload a map? Have no fear! I added the data to #OpenStreetMap #OSM and used #OverpassTurbo to plot it.

@akkana It's great you were able to write some code to get this data. I love coding to solve problems!
Just wondering if you know about #OverpassTurbo? It let's you query #OpenStreetMap data quite easily...
Hey, #OSM- / #OverpassTurbo -Cracks! Wie kann ich die Tags, nach denen ich hier suche, jeweils verschieden einfärben?
[out:json][timeout:25];
{{geocodeArea:xxx}}->.searchArea;
(
nwr["parking:lane:right"]["parking:lane:right"!="no"](area.searchArea);
nwr["parking:right"]["parking:right"!="no"](area.searchArea);
nwr["parking:lane:left"]["parking:lane:left"!="no"](area.searchArea);
nwr["parking:left"]["parking:left"!="no"](area.searchArea);
);
out geom;
 Karten öffentlicher Tischtennis-Platten
  (PingPongMap, OpenStreetMap, uMap)
#PingPongMap pingpongmap.net/
(Info via @Tifi )
....schade, dass die “PingPongMap” wohl keine #OpenStreetMap -Basis hat und auch die Angaben von #OSM nicht ergänzend nutzt. Eine Kombination aus beidem wäre m.E. optimal: die PingPongMap, die auch zu den Orten Bilder und “Bewertungen” der Platten enthält, und die OSM-Daten, die für die meisten Regionen ziemlich vollständig sein sollten. Exemplarisch für #Wuppertal ist auch zu sehen, dass in OSM einige TT-Orte dabei sind, die in der PingPongMap aber fehlen.
Auf dieser Karte von @MapComplete sind die #Tischtennis-Orte zumindest schön mit einem -Symbol dargestellt und gut zu finden: mapcomplete.org/sport_pitches?…
Eine #OverpassTurbo -Abfrage findet gezielt #Tischtennis -Orte in den #OpenStreetMap -Daten (links obenn auf „Ausführen“ klicken): overpass-turbo.eu/s/1sld
(via @kdkeller )
Auf #uMap sind regionale Karten für #Insbruck #Berlin & #Dresden zu finden: umap.openstreetmap.fr/de/searc…
Habt Ihr Erfahrungen damit? Kennt Ihr noch weitere Karten, die Tischtennis-Orte anzeigen?
[Repost wg. Umzug der #Tischtennis -Community von #fedditDe auf #fedditOrg = tischtennis@feddit.org - Der alte Post + Antworten auf feddit.de sind u.a. noch hier zu sehen: [url=https://feddit.org/post/8719?sort=Old[/url]


Over the weekend I implemented a number of charts and graphs looking into the data contributed by Better Intersections volunteers.
I wrote them up using Observable Plots and a lot of caching to prevent an avalanche of requests to Overpass Turbo.
All data and code is open source, PRs welcome!
https://jakecoppinger.com/2024/07/preliminary-analysis-of-better-intersections-data/
Want to be a hero on #openstreetmap today?
Run the overpass query on overpass-turbo.eu
```
[bbox:{{bbox}}];
way["highway"]->.roads;
way["landuse"]->.landuse;
node(w.roads)(w.landuse);
out;
```
on an area of your choice and fix landuse that is glued to streets.