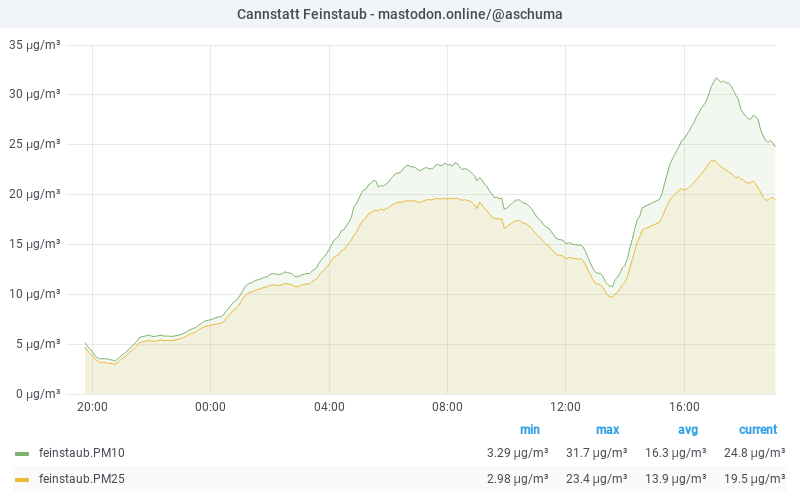
air tweets - cannstatt<p>DAILY AIR QUALITY UPDATE<br> <br><a href="https://mastodon.online/tags/Feinstaub" class="mention hashtag" rel="nofollow noopener noreferrer" target="_blank">#<span>Feinstaub</span></a> in <a href="https://mastodon.online/tags/Cannstatt" class="mention hashtag" rel="nofollow noopener noreferrer" target="_blank">#<span>Cannstatt</span></a> / <a href="https://mastodon.online/tags/Stuttgart" class="mention hashtag" rel="nofollow noopener noreferrer" target="_blank">#<span>Stuttgart</span></a> (15.04.2025 20:06 CET)<br> <br>PM10: 2.1 µg/m³<br>PM2.5: 1.9 µg/m³<br> <br>Details: <a href="https://maps.sensor.community/#15/48.8040/9.2280" rel="nofollow noopener noreferrer" translate="no" target="_blank"><span class="invisible">https://</span><span class="ellipsis">maps.sensor.community/#15/48.8</span><span class="invisible">040/9.2280</span></a><br> <br>This is a bot. Code is available on github aschuma/air_tweets.<br> <br><a href="https://mastodon.online/tags/Luftverschmutzung" class="mention hashtag" rel="nofollow noopener noreferrer" target="_blank">#<span>Luftverschmutzung</span></a> <a href="https://mastodon.online/tags/Particulatematter" class="mention hashtag" rel="nofollow noopener noreferrer" target="_blank">#<span>Particulatematter</span></a> <a href="https://mastodon.online/tags/Opendata" class="mention hashtag" rel="nofollow noopener noreferrer" target="_blank">#<span>Opendata</span></a> <a href="https://mastodon.online/tags/Civictech" class="mention hashtag" rel="nofollow noopener noreferrer" target="_blank">#<span>Civictech</span></a> <a href="https://mastodon.online/tags/Airrohr" class="mention hashtag" rel="nofollow noopener noreferrer" target="_blank">#<span>Airrohr</span></a> <a href="https://mastodon.online/tags/Airpollution" class="mention hashtag" rel="nofollow noopener noreferrer" target="_blank">#<span>Airpollution</span></a> <a href="https://mastodon.online/tags/Airquality" class="mention hashtag" rel="nofollow noopener noreferrer" target="_blank">#<span>Airquality</span></a></p>
Recent searches
No recent searches
Search options
Only available when logged in.
norden.social is one of the many independent Mastodon servers you can use to participate in the fediverse.
Moin! Dies ist die Mastodon-Instanz für Nordlichter, Schnacker und alles dazwischen. Folge dem Leuchtturm.
Administered by:
Server stats:
3.5Kactive users
norden.social: About · Status · Profiles directory · Privacy policy
Mastodon: About · Get the app · Keyboard shortcuts · View source code · v4.3.7
#airrohr
4 posts · 4 participants · 0 posts today
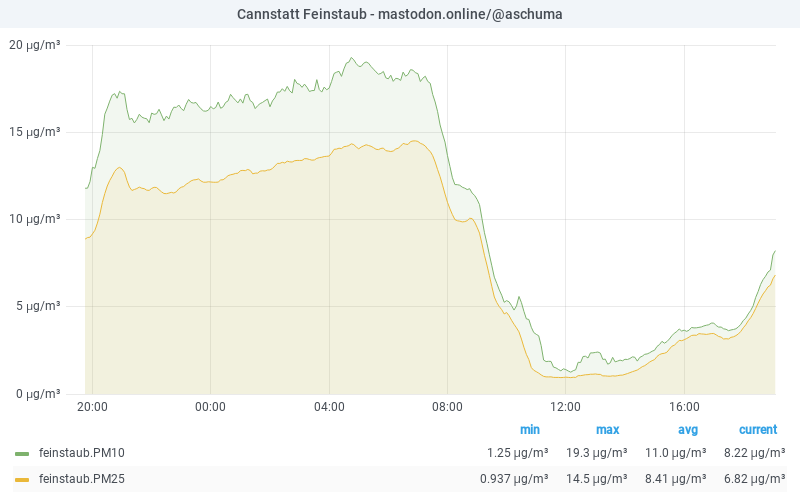
air tweets - cannstatt<p>DAILY AIR QUALITY UPDATE<br> <br><a href="https://mastodon.online/tags/Feinstaub" class="mention hashtag" rel="nofollow noopener noreferrer" target="_blank">#<span>Feinstaub</span></a> in <a href="https://mastodon.online/tags/Cannstatt" class="mention hashtag" rel="nofollow noopener noreferrer" target="_blank">#<span>Cannstatt</span></a> / <a href="https://mastodon.online/tags/Stuttgart" class="mention hashtag" rel="nofollow noopener noreferrer" target="_blank">#<span>Stuttgart</span></a> (13.04.2025 20:06 CET)<br> <br>PM10: 3.2 µg/m³<br>PM2.5: 2.6 µg/m³<br> <br>Details: <a href="https://maps.sensor.community/#15/48.8040/9.2280" rel="nofollow noopener noreferrer" translate="no" target="_blank"><span class="invisible">https://</span><span class="ellipsis">maps.sensor.community/#15/48.8</span><span class="invisible">040/9.2280</span></a><br> <br>This is a bot. Code is available on github aschuma/air_tweets.<br> <br><a href="https://mastodon.online/tags/Luftverschmutzung" class="mention hashtag" rel="nofollow noopener noreferrer" target="_blank">#<span>Luftverschmutzung</span></a> <a href="https://mastodon.online/tags/Particulatematter" class="mention hashtag" rel="nofollow noopener noreferrer" target="_blank">#<span>Particulatematter</span></a> <a href="https://mastodon.online/tags/Opendata" class="mention hashtag" rel="nofollow noopener noreferrer" target="_blank">#<span>Opendata</span></a> <a href="https://mastodon.online/tags/Civictech" class="mention hashtag" rel="nofollow noopener noreferrer" target="_blank">#<span>Civictech</span></a> <a href="https://mastodon.online/tags/Airrohr" class="mention hashtag" rel="nofollow noopener noreferrer" target="_blank">#<span>Airrohr</span></a> <a href="https://mastodon.online/tags/Airpollution" class="mention hashtag" rel="nofollow noopener noreferrer" target="_blank">#<span>Airpollution</span></a> <a href="https://mastodon.online/tags/Airquality" class="mention hashtag" rel="nofollow noopener noreferrer" target="_blank">#<span>Airquality</span></a></p>
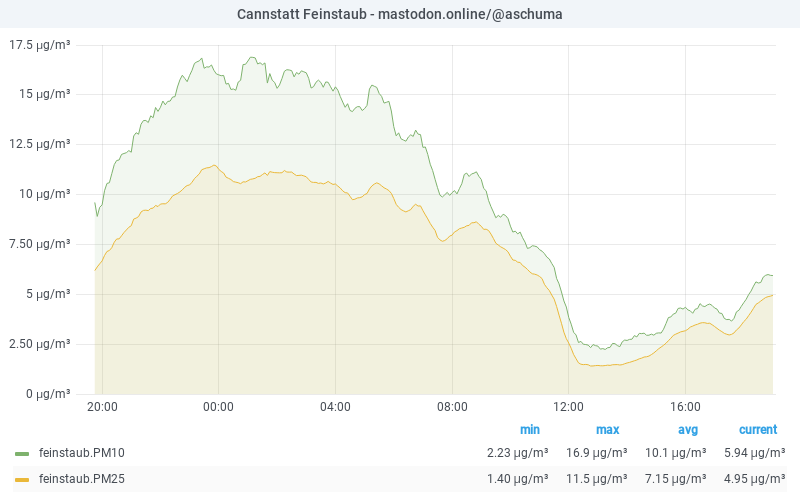
air tweets - cannstatt<p>DAILY AIR QUALITY UPDATE<br> <br><a href="https://mastodon.online/tags/Feinstaub" class="mention hashtag" rel="nofollow noopener noreferrer" target="_blank">#<span>Feinstaub</span></a> in <a href="https://mastodon.online/tags/Cannstatt" class="mention hashtag" rel="nofollow noopener noreferrer" target="_blank">#<span>Cannstatt</span></a> / <a href="https://mastodon.online/tags/Stuttgart" class="mention hashtag" rel="nofollow noopener noreferrer" target="_blank">#<span>Stuttgart</span></a> (11.04.2025 20:06 CET)<br> <br>PM10: 6.5 µg/m³<br>PM2.5: 3.5 µg/m³<br> <br>Details: <a href="https://maps.sensor.community/#15/48.8040/9.2280" rel="nofollow noopener noreferrer" translate="no" target="_blank"><span class="invisible">https://</span><span class="ellipsis">maps.sensor.community/#15/48.8</span><span class="invisible">040/9.2280</span></a><br> <br>This is a bot. Code is available on github aschuma/air_tweets.<br> <br><a href="https://mastodon.online/tags/Luftverschmutzung" class="mention hashtag" rel="nofollow noopener noreferrer" target="_blank">#<span>Luftverschmutzung</span></a> <a href="https://mastodon.online/tags/Particulatematter" class="mention hashtag" rel="nofollow noopener noreferrer" target="_blank">#<span>Particulatematter</span></a> <a href="https://mastodon.online/tags/Opendata" class="mention hashtag" rel="nofollow noopener noreferrer" target="_blank">#<span>Opendata</span></a> <a href="https://mastodon.online/tags/Civictech" class="mention hashtag" rel="nofollow noopener noreferrer" target="_blank">#<span>Civictech</span></a> <a href="https://mastodon.online/tags/Airrohr" class="mention hashtag" rel="nofollow noopener noreferrer" target="_blank">#<span>Airrohr</span></a> <a href="https://mastodon.online/tags/Airpollution" class="mention hashtag" rel="nofollow noopener noreferrer" target="_blank">#<span>Airpollution</span></a> <a href="https://mastodon.online/tags/Airquality" class="mention hashtag" rel="nofollow noopener noreferrer" target="_blank">#<span>Airquality</span></a></p>
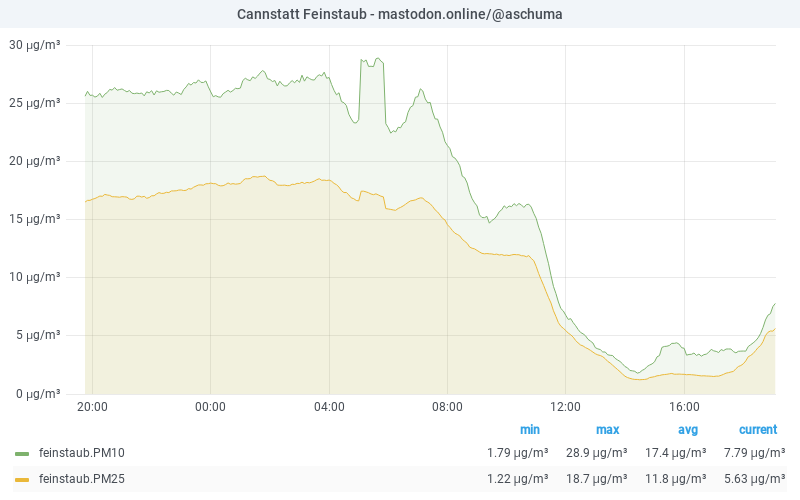
air tweets - cannstatt<p>DAILY AIR QUALITY UPDATE<br> <br><a href="https://mastodon.online/tags/Feinstaub" class="mention hashtag" rel="nofollow noopener noreferrer" target="_blank">#<span>Feinstaub</span></a> in <a href="https://mastodon.online/tags/Cannstatt" class="mention hashtag" rel="nofollow noopener noreferrer" target="_blank">#<span>Cannstatt</span></a> / <a href="https://mastodon.online/tags/Stuttgart" class="mention hashtag" rel="nofollow noopener noreferrer" target="_blank">#<span>Stuttgart</span></a> (10.04.2025 20:06 CET)<br> <br>PM10: 33.1 µg/m³<br>PM2.5: 12.1 µg/m³<br> <br>Details: <a href="https://maps.sensor.community/#15/48.8040/9.2280" rel="nofollow noopener noreferrer" translate="no" target="_blank"><span class="invisible">https://</span><span class="ellipsis">maps.sensor.community/#15/48.8</span><span class="invisible">040/9.2280</span></a><br> <br>This is a bot. Code is available on github aschuma/air_tweets.<br> <br><a href="https://mastodon.online/tags/Luftverschmutzung" class="mention hashtag" rel="nofollow noopener noreferrer" target="_blank">#<span>Luftverschmutzung</span></a> <a href="https://mastodon.online/tags/Particulatematter" class="mention hashtag" rel="nofollow noopener noreferrer" target="_blank">#<span>Particulatematter</span></a> <a href="https://mastodon.online/tags/Opendata" class="mention hashtag" rel="nofollow noopener noreferrer" target="_blank">#<span>Opendata</span></a> <a href="https://mastodon.online/tags/Civictech" class="mention hashtag" rel="nofollow noopener noreferrer" target="_blank">#<span>Civictech</span></a> <a href="https://mastodon.online/tags/Airrohr" class="mention hashtag" rel="nofollow noopener noreferrer" target="_blank">#<span>Airrohr</span></a> <a href="https://mastodon.online/tags/Airpollution" class="mention hashtag" rel="nofollow noopener noreferrer" target="_blank">#<span>Airpollution</span></a> <a href="https://mastodon.online/tags/Airquality" class="mention hashtag" rel="nofollow noopener noreferrer" target="_blank">#<span>Airquality</span></a></p>
air tweets - cannstatt<p>DAILY AIR QUALITY UPDATE<br> <br><a href="https://mastodon.online/tags/Feinstaub" class="mention hashtag" rel="nofollow noopener noreferrer" target="_blank">#<span>Feinstaub</span></a> in <a href="https://mastodon.online/tags/Cannstatt" class="mention hashtag" rel="nofollow noopener noreferrer" target="_blank">#<span>Cannstatt</span></a> / <a href="https://mastodon.online/tags/Stuttgart" class="mention hashtag" rel="nofollow noopener noreferrer" target="_blank">#<span>Stuttgart</span></a> (09.04.2025 20:06 CET)<br> <br>PM10: 3.1 µg/m³<br>PM2.5: 2.1 µg/m³<br> <br>Details: <a href="https://maps.sensor.community/#15/48.8040/9.2280" rel="nofollow noopener noreferrer" translate="no" target="_blank"><span class="invisible">https://</span><span class="ellipsis">maps.sensor.community/#15/48.8</span><span class="invisible">040/9.2280</span></a><br> <br>This is a bot. Code is available on github aschuma/air_tweets.<br> <br><a href="https://mastodon.online/tags/Luftverschmutzung" class="mention hashtag" rel="nofollow noopener noreferrer" target="_blank">#<span>Luftverschmutzung</span></a> <a href="https://mastodon.online/tags/Particulatematter" class="mention hashtag" rel="nofollow noopener noreferrer" target="_blank">#<span>Particulatematter</span></a> <a href="https://mastodon.online/tags/Opendata" class="mention hashtag" rel="nofollow noopener noreferrer" target="_blank">#<span>Opendata</span></a> <a href="https://mastodon.online/tags/Civictech" class="mention hashtag" rel="nofollow noopener noreferrer" target="_blank">#<span>Civictech</span></a> <a href="https://mastodon.online/tags/Airrohr" class="mention hashtag" rel="nofollow noopener noreferrer" target="_blank">#<span>Airrohr</span></a> <a href="https://mastodon.online/tags/Airpollution" class="mention hashtag" rel="nofollow noopener noreferrer" target="_blank">#<span>Airpollution</span></a> <a href="https://mastodon.online/tags/Airquality" class="mention hashtag" rel="nofollow noopener noreferrer" target="_blank">#<span>Airquality</span></a></p>
air tweets - cannstatt<p>DAILY AIR QUALITY UPDATE<br> <br><a href="https://mastodon.online/tags/Feinstaub" class="mention hashtag" rel="nofollow noopener noreferrer" target="_blank">#<span>Feinstaub</span></a> in <a href="https://mastodon.online/tags/Cannstatt" class="mention hashtag" rel="nofollow noopener noreferrer" target="_blank">#<span>Cannstatt</span></a> / <a href="https://mastodon.online/tags/Stuttgart" class="mention hashtag" rel="nofollow noopener noreferrer" target="_blank">#<span>Stuttgart</span></a> (08.04.2025 20:06 CET)<br> <br>PM10: 3.6 µg/m³<br>PM2.5: 2.4 µg/m³<br> <br>Details: <a href="https://maps.sensor.community/#15/48.8040/9.2280" rel="nofollow noopener noreferrer" translate="no" target="_blank"><span class="invisible">https://</span><span class="ellipsis">maps.sensor.community/#15/48.8</span><span class="invisible">040/9.2280</span></a><br> <br>This is a bot. Code is available on github aschuma/air_tweets.<br> <br><a href="https://mastodon.online/tags/Luftverschmutzung" class="mention hashtag" rel="nofollow noopener noreferrer" target="_blank">#<span>Luftverschmutzung</span></a> <a href="https://mastodon.online/tags/Particulatematter" class="mention hashtag" rel="nofollow noopener noreferrer" target="_blank">#<span>Particulatematter</span></a> <a href="https://mastodon.online/tags/Opendata" class="mention hashtag" rel="nofollow noopener noreferrer" target="_blank">#<span>Opendata</span></a> <a href="https://mastodon.online/tags/Civictech" class="mention hashtag" rel="nofollow noopener noreferrer" target="_blank">#<span>Civictech</span></a> <a href="https://mastodon.online/tags/Airrohr" class="mention hashtag" rel="nofollow noopener noreferrer" target="_blank">#<span>Airrohr</span></a> <a href="https://mastodon.online/tags/Airpollution" class="mention hashtag" rel="nofollow noopener noreferrer" target="_blank">#<span>Airpollution</span></a> <a href="https://mastodon.online/tags/Airquality" class="mention hashtag" rel="nofollow noopener noreferrer" target="_blank">#<span>Airquality</span></a></p>
air tweets - cannstatt<p>DAILY AIR QUALITY UPDATE<br> <br><a href="https://mastodon.online/tags/Feinstaub" class="mention hashtag" rel="nofollow noopener noreferrer" target="_blank">#<span>Feinstaub</span></a> in <a href="https://mastodon.online/tags/Cannstatt" class="mention hashtag" rel="nofollow noopener noreferrer" target="_blank">#<span>Cannstatt</span></a> / <a href="https://mastodon.online/tags/Stuttgart" class="mention hashtag" rel="nofollow noopener noreferrer" target="_blank">#<span>Stuttgart</span></a> (07.04.2025 20:06 CET)<br> <br>PM10: 2.8 µg/m³<br>PM2.5: 1.6 µg/m³<br> <br>Details: <a href="https://maps.sensor.community/#15/48.8040/9.2280" rel="nofollow noopener noreferrer" translate="no" target="_blank"><span class="invisible">https://</span><span class="ellipsis">maps.sensor.community/#15/48.8</span><span class="invisible">040/9.2280</span></a><br> <br>This is a bot. Code is available on github aschuma/air_tweets.<br> <br><a href="https://mastodon.online/tags/Luftverschmutzung" class="mention hashtag" rel="nofollow noopener noreferrer" target="_blank">#<span>Luftverschmutzung</span></a> <a href="https://mastodon.online/tags/Particulatematter" class="mention hashtag" rel="nofollow noopener noreferrer" target="_blank">#<span>Particulatematter</span></a> <a href="https://mastodon.online/tags/Opendata" class="mention hashtag" rel="nofollow noopener noreferrer" target="_blank">#<span>Opendata</span></a> <a href="https://mastodon.online/tags/Civictech" class="mention hashtag" rel="nofollow noopener noreferrer" target="_blank">#<span>Civictech</span></a> <a href="https://mastodon.online/tags/Airrohr" class="mention hashtag" rel="nofollow noopener noreferrer" target="_blank">#<span>Airrohr</span></a> <a href="https://mastodon.online/tags/Airpollution" class="mention hashtag" rel="nofollow noopener noreferrer" target="_blank">#<span>Airpollution</span></a> <a href="https://mastodon.online/tags/Airquality" class="mention hashtag" rel="nofollow noopener noreferrer" target="_blank">#<span>Airquality</span></a></p>
air tweets - cannstatt<p>DAILY AIR QUALITY UPDATE<br> <br><a href="https://mastodon.online/tags/Feinstaub" class="mention hashtag" rel="nofollow noopener noreferrer" target="_blank">#<span>Feinstaub</span></a> in <a href="https://mastodon.online/tags/Cannstatt" class="mention hashtag" rel="nofollow noopener noreferrer" target="_blank">#<span>Cannstatt</span></a> / <a href="https://mastodon.online/tags/Stuttgart" class="mention hashtag" rel="nofollow noopener noreferrer" target="_blank">#<span>Stuttgart</span></a> (05.04.2025 20:06 CET)<br> <br>PM10: 6.8 µg/m³<br>PM2.5: 5.0 µg/m³<br> <br>Details: <a href="https://maps.sensor.community/#15/48.8040/9.2280" rel="nofollow noopener noreferrer" translate="no" target="_blank"><span class="invisible">https://</span><span class="ellipsis">maps.sensor.community/#15/48.8</span><span class="invisible">040/9.2280</span></a><br> <br>This is a bot. Code is available on github aschuma/air_tweets.<br> <br><a href="https://mastodon.online/tags/Luftverschmutzung" class="mention hashtag" rel="nofollow noopener noreferrer" target="_blank">#<span>Luftverschmutzung</span></a> <a href="https://mastodon.online/tags/Particulatematter" class="mention hashtag" rel="nofollow noopener noreferrer" target="_blank">#<span>Particulatematter</span></a> <a href="https://mastodon.online/tags/Opendata" class="mention hashtag" rel="nofollow noopener noreferrer" target="_blank">#<span>Opendata</span></a> <a href="https://mastodon.online/tags/Civictech" class="mention hashtag" rel="nofollow noopener noreferrer" target="_blank">#<span>Civictech</span></a> <a href="https://mastodon.online/tags/Airrohr" class="mention hashtag" rel="nofollow noopener noreferrer" target="_blank">#<span>Airrohr</span></a> <a href="https://mastodon.online/tags/Airpollution" class="mention hashtag" rel="nofollow noopener noreferrer" target="_blank">#<span>Airpollution</span></a> <a href="https://mastodon.online/tags/Airquality" class="mention hashtag" rel="nofollow noopener noreferrer" target="_blank">#<span>Airquality</span></a></p>
air tweets - cannstatt<p>DAILY AIR QUALITY UPDATE<br> <br><a href="https://mastodon.online/tags/Feinstaub" class="mention hashtag" rel="nofollow noopener noreferrer" target="_blank">#<span>Feinstaub</span></a> in <a href="https://mastodon.online/tags/Cannstatt" class="mention hashtag" rel="nofollow noopener noreferrer" target="_blank">#<span>Cannstatt</span></a> / <a href="https://mastodon.online/tags/Stuttgart" class="mention hashtag" rel="nofollow noopener noreferrer" target="_blank">#<span>Stuttgart</span></a> (04.04.2025 20:06 CET)<br> <br>PM10: 3.5 µg/m³<br>PM2.5: 2.5 µg/m³<br> <br>Details: <a href="https://maps.sensor.community/#15/48.8040/9.2280" rel="nofollow noopener noreferrer" translate="no" target="_blank"><span class="invisible">https://</span><span class="ellipsis">maps.sensor.community/#15/48.8</span><span class="invisible">040/9.2280</span></a><br> <br>This is a bot. Code is available on github aschuma/air_tweets.<br> <br><a href="https://mastodon.online/tags/Luftverschmutzung" class="mention hashtag" rel="nofollow noopener noreferrer" target="_blank">#<span>Luftverschmutzung</span></a> <a href="https://mastodon.online/tags/Particulatematter" class="mention hashtag" rel="nofollow noopener noreferrer" target="_blank">#<span>Particulatematter</span></a> <a href="https://mastodon.online/tags/Opendata" class="mention hashtag" rel="nofollow noopener noreferrer" target="_blank">#<span>Opendata</span></a> <a href="https://mastodon.online/tags/Civictech" class="mention hashtag" rel="nofollow noopener noreferrer" target="_blank">#<span>Civictech</span></a> <a href="https://mastodon.online/tags/Airrohr" class="mention hashtag" rel="nofollow noopener noreferrer" target="_blank">#<span>Airrohr</span></a> <a href="https://mastodon.online/tags/Airpollution" class="mention hashtag" rel="nofollow noopener noreferrer" target="_blank">#<span>Airpollution</span></a> <a href="https://mastodon.online/tags/Airquality" class="mention hashtag" rel="nofollow noopener noreferrer" target="_blank">#<span>Airquality</span></a></p>
air tweets - cannstatt<p>DAILY AIR QUALITY UPDATE<br> <br><a href="https://mastodon.online/tags/Feinstaub" class="mention hashtag" rel="nofollow noopener noreferrer" target="_blank">#<span>Feinstaub</span></a> in <a href="https://mastodon.online/tags/Cannstatt" class="mention hashtag" rel="nofollow noopener noreferrer" target="_blank">#<span>Cannstatt</span></a> / <a href="https://mastodon.online/tags/Stuttgart" class="mention hashtag" rel="nofollow noopener noreferrer" target="_blank">#<span>Stuttgart</span></a> (03.04.2025 20:06 CET)<br> <br>PM10: 4.5 µg/m³<br>PM2.5: 3.8 µg/m³<br> <br>Details: <a href="https://maps.sensor.community/#15/48.8040/9.2280" rel="nofollow noopener noreferrer" translate="no" target="_blank"><span class="invisible">https://</span><span class="ellipsis">maps.sensor.community/#15/48.8</span><span class="invisible">040/9.2280</span></a><br> <br>This is a bot. Code is available on github aschuma/air_tweets.<br> <br><a href="https://mastodon.online/tags/Luftverschmutzung" class="mention hashtag" rel="nofollow noopener noreferrer" target="_blank">#<span>Luftverschmutzung</span></a> <a href="https://mastodon.online/tags/Particulatematter" class="mention hashtag" rel="nofollow noopener noreferrer" target="_blank">#<span>Particulatematter</span></a> <a href="https://mastodon.online/tags/Opendata" class="mention hashtag" rel="nofollow noopener noreferrer" target="_blank">#<span>Opendata</span></a> <a href="https://mastodon.online/tags/Civictech" class="mention hashtag" rel="nofollow noopener noreferrer" target="_blank">#<span>Civictech</span></a> <a href="https://mastodon.online/tags/Airrohr" class="mention hashtag" rel="nofollow noopener noreferrer" target="_blank">#<span>Airrohr</span></a> <a href="https://mastodon.online/tags/Airpollution" class="mention hashtag" rel="nofollow noopener noreferrer" target="_blank">#<span>Airpollution</span></a> <a href="https://mastodon.online/tags/Airquality" class="mention hashtag" rel="nofollow noopener noreferrer" target="_blank">#<span>Airquality</span></a></p>
air tweets - cannstatt<p>DAILY AIR QUALITY UPDATE<br> <br><a href="https://mastodon.online/tags/Feinstaub" class="mention hashtag" rel="nofollow noopener noreferrer" target="_blank">#<span>Feinstaub</span></a> in <a href="https://mastodon.online/tags/Cannstatt" class="mention hashtag" rel="nofollow noopener noreferrer" target="_blank">#<span>Cannstatt</span></a> / <a href="https://mastodon.online/tags/Stuttgart" class="mention hashtag" rel="nofollow noopener noreferrer" target="_blank">#<span>Stuttgart</span></a> (02.04.2025 20:06 CET)<br> <br>PM10: 5.1 µg/m³<br>PM2.5: 3.9 µg/m³<br> <br>Details: <a href="https://maps.sensor.community/#15/48.8040/9.2280" rel="nofollow noopener noreferrer" translate="no" target="_blank"><span class="invisible">https://</span><span class="ellipsis">maps.sensor.community/#15/48.8</span><span class="invisible">040/9.2280</span></a><br> <br>This is a bot. Code is available on github aschuma/air_tweets.<br> <br><a href="https://mastodon.online/tags/Luftverschmutzung" class="mention hashtag" rel="nofollow noopener noreferrer" target="_blank">#<span>Luftverschmutzung</span></a> <a href="https://mastodon.online/tags/Particulatematter" class="mention hashtag" rel="nofollow noopener noreferrer" target="_blank">#<span>Particulatematter</span></a> <a href="https://mastodon.online/tags/Opendata" class="mention hashtag" rel="nofollow noopener noreferrer" target="_blank">#<span>Opendata</span></a> <a href="https://mastodon.online/tags/Civictech" class="mention hashtag" rel="nofollow noopener noreferrer" target="_blank">#<span>Civictech</span></a> <a href="https://mastodon.online/tags/Airrohr" class="mention hashtag" rel="nofollow noopener noreferrer" target="_blank">#<span>Airrohr</span></a> <a href="https://mastodon.online/tags/Airpollution" class="mention hashtag" rel="nofollow noopener noreferrer" target="_blank">#<span>Airpollution</span></a> <a href="https://mastodon.online/tags/Airquality" class="mention hashtag" rel="nofollow noopener noreferrer" target="_blank">#<span>Airquality</span></a></p>
air tweets - cannstatt<p>DAILY AIR QUALITY UPDATE<br> <br><a href="https://mastodon.online/tags/Feinstaub" class="mention hashtag" rel="nofollow noopener noreferrer" target="_blank">#<span>Feinstaub</span></a> in <a href="https://mastodon.online/tags/Cannstatt" class="mention hashtag" rel="nofollow noopener noreferrer" target="_blank">#<span>Cannstatt</span></a> / <a href="https://mastodon.online/tags/Stuttgart" class="mention hashtag" rel="nofollow noopener noreferrer" target="_blank">#<span>Stuttgart</span></a> (29.03.2025 20:06 CET)<br> <br>PM10: 6.0 µg/m³<br>PM2.5: 4.2 µg/m³<br> <br>Details: <a href="https://maps.sensor.community/#15/48.8040/9.2280" rel="nofollow noopener noreferrer" translate="no" target="_blank"><span class="invisible">https://</span><span class="ellipsis">maps.sensor.community/#15/48.8</span><span class="invisible">040/9.2280</span></a><br> <br>This is a bot. Code is available on github aschuma/air_tweets.<br> <br><a href="https://mastodon.online/tags/Luftverschmutzung" class="mention hashtag" rel="nofollow noopener noreferrer" target="_blank">#<span>Luftverschmutzung</span></a> <a href="https://mastodon.online/tags/Particulatematter" class="mention hashtag" rel="nofollow noopener noreferrer" target="_blank">#<span>Particulatematter</span></a> <a href="https://mastodon.online/tags/Opendata" class="mention hashtag" rel="nofollow noopener noreferrer" target="_blank">#<span>Opendata</span></a> <a href="https://mastodon.online/tags/Civictech" class="mention hashtag" rel="nofollow noopener noreferrer" target="_blank">#<span>Civictech</span></a> <a href="https://mastodon.online/tags/Airrohr" class="mention hashtag" rel="nofollow noopener noreferrer" target="_blank">#<span>Airrohr</span></a> <a href="https://mastodon.online/tags/Airpollution" class="mention hashtag" rel="nofollow noopener noreferrer" target="_blank">#<span>Airpollution</span></a> <a href="https://mastodon.online/tags/Airquality" class="mention hashtag" rel="nofollow noopener noreferrer" target="_blank">#<span>Airquality</span></a></p>
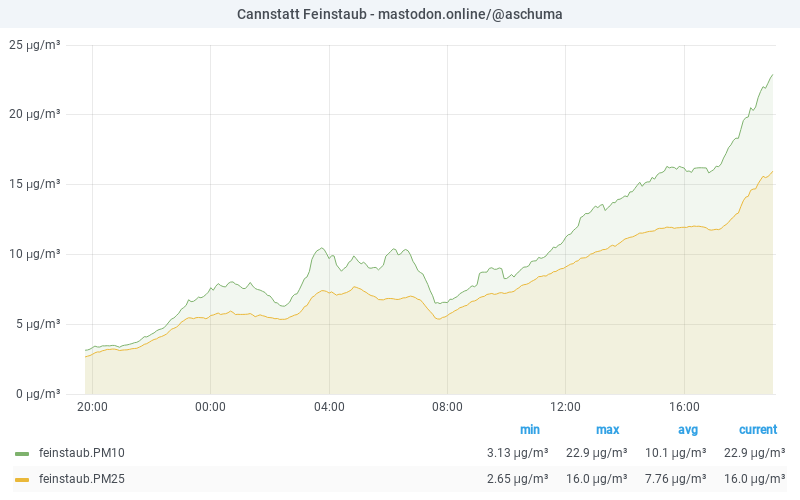
air tweets - cannstatt<p>⚠️ <a href="https://mastodon.online/tags/Feinstaubalarm" class="mention hashtag" rel="nofollow noopener noreferrer" target="_blank">#<span>Feinstaubalarm</span></a> in <a href="https://mastodon.online/tags/Cannstatt" class="mention hashtag" rel="nofollow noopener noreferrer" target="_blank">#<span>Cannstatt</span></a> / <a href="https://mastodon.online/tags/Stuttgart" class="mention hashtag" rel="nofollow noopener noreferrer" target="_blank">#<span>Stuttgart</span></a> (26.03.2025 10:30 CET)<br> <br>The hourly average of the Cannstatt Seelberg <a href="https://mastodon.online/tags/PM10" class="mention hashtag" rel="nofollow noopener noreferrer" target="_blank">#<span>PM10</span></a> sensor has exceeded 50 µg/m³.<br> <br>PM10: 75.2 µg/m³<br>PM2.5: 44.6 µg/m³<br> <br>Details: <a href="https://maps.sensor.community/#15/48.8040/9.2280" rel="nofollow noopener noreferrer" translate="no" target="_blank"><span class="invisible">https://</span><span class="ellipsis">maps.sensor.community/#15/48.8</span><span class="invisible">040/9.2280</span></a><br> <br> <br><a href="https://mastodon.online/tags/Feinstaub" class="mention hashtag" rel="nofollow noopener noreferrer" target="_blank">#<span>Feinstaub</span></a> <a href="https://mastodon.online/tags/Luftverschmutzung" class="mention hashtag" rel="nofollow noopener noreferrer" target="_blank">#<span>Luftverschmutzung</span></a> <a href="https://mastodon.online/tags/Particulatematter" class="mention hashtag" rel="nofollow noopener noreferrer" target="_blank">#<span>Particulatematter</span></a> <a href="https://mastodon.online/tags/Opendata" class="mention hashtag" rel="nofollow noopener noreferrer" target="_blank">#<span>Opendata</span></a> <a href="https://mastodon.online/tags/Civictech" class="mention hashtag" rel="nofollow noopener noreferrer" target="_blank">#<span>Civictech</span></a> <a href="https://mastodon.online/tags/Airrohr" class="mention hashtag" rel="nofollow noopener noreferrer" target="_blank">#<span>Airrohr</span></a> <a href="https://mastodon.online/tags/Airpollution" class="mention hashtag" rel="nofollow noopener noreferrer" target="_blank">#<span>Airpollution</span></a> <a href="https://mastodon.online/tags/Airquality" class="mention hashtag" rel="nofollow noopener noreferrer" target="_blank">#<span>Airquality</span></a></p>
air tweets - cannstatt<p>⚠️ <a href="https://mastodon.online/tags/Feinstaubalarm" class="mention hashtag" rel="nofollow noopener noreferrer" target="_blank">#<span>Feinstaubalarm</span></a> in <a href="https://mastodon.online/tags/Cannstatt" class="mention hashtag" rel="nofollow noopener noreferrer" target="_blank">#<span>Cannstatt</span></a> / <a href="https://mastodon.online/tags/Stuttgart" class="mention hashtag" rel="nofollow noopener noreferrer" target="_blank">#<span>Stuttgart</span></a> (26.03.2025 04:15 CET)<br> <br>The hourly average of the Cannstatt Seelberg <a href="https://mastodon.online/tags/PM10" class="mention hashtag" rel="nofollow noopener noreferrer" target="_blank">#<span>PM10</span></a> sensor has exceeded 50 µg/m³.<br> <br>PM10: 51.9 µg/m³<br>PM2.5: 33.0 µg/m³<br> <br>Details: <a href="https://maps.sensor.community/#15/48.8040/9.2280" rel="nofollow noopener noreferrer" translate="no" target="_blank"><span class="invisible">https://</span><span class="ellipsis">maps.sensor.community/#15/48.8</span><span class="invisible">040/9.2280</span></a><br> <br> <br><a href="https://mastodon.online/tags/Feinstaub" class="mention hashtag" rel="nofollow noopener noreferrer" target="_blank">#<span>Feinstaub</span></a> <a href="https://mastodon.online/tags/Luftverschmutzung" class="mention hashtag" rel="nofollow noopener noreferrer" target="_blank">#<span>Luftverschmutzung</span></a> <a href="https://mastodon.online/tags/Particulatematter" class="mention hashtag" rel="nofollow noopener noreferrer" target="_blank">#<span>Particulatematter</span></a> <a href="https://mastodon.online/tags/Opendata" class="mention hashtag" rel="nofollow noopener noreferrer" target="_blank">#<span>Opendata</span></a> <a href="https://mastodon.online/tags/Civictech" class="mention hashtag" rel="nofollow noopener noreferrer" target="_blank">#<span>Civictech</span></a> <a href="https://mastodon.online/tags/Airrohr" class="mention hashtag" rel="nofollow noopener noreferrer" target="_blank">#<span>Airrohr</span></a> <a href="https://mastodon.online/tags/Airpollution" class="mention hashtag" rel="nofollow noopener noreferrer" target="_blank">#<span>Airpollution</span></a> <a href="https://mastodon.online/tags/Airquality" class="mention hashtag" rel="nofollow noopener noreferrer" target="_blank">#<span>Airquality</span></a></p>

DAILY AIR QUALITY UPDATE
#Feinstaub in #Cannstatt / #Stuttgart (25.03.2025 20:06 CET)
PM10: 25.2 µg/m³
PM2.5: 19.6 µg/m³
Details: https://maps.sensor.community/#15/48.8040/9.2280
This is a bot. Code is available on github aschuma/air_tweets.
#Luftverschmutzung #Particulatematter #Opendata #Civictech #Airrohr #Airpollution #Airquality
DAILY AIR QUALITY UPDATE
#Feinstaub in #Cannstatt / #Stuttgart (23.03.2025 20:06 CET)
PM10: 7.6 µg/m³
PM2.5: 6.4 µg/m³
Details: https://maps.sensor.community/#15/48.8040/9.2280
This is a bot. Code is available on github aschuma/air_tweets.
#Luftverschmutzung #Particulatematter #Opendata #Civictech #Airrohr #Airpollution #Airquality
DAILY AIR QUALITY UPDATE
#Feinstaub in #Cannstatt / #Stuttgart (21.03.2025 20:06 CET)
PM10: 5.9 µg/m³
PM2.5: 4.9 µg/m³
Details: https://maps.sensor.community/#15/48.8040/9.2280
This is a bot. Code is available on github aschuma/air_tweets.
#Luftverschmutzung #Particulatematter #Opendata #Civictech #Airrohr #Airpollution #Airquality

Das liegt jetzt schon seit Monaten bei mir auf dem Tisch, heute bin ich dazu gekommen, die ersten Schritte zu machen: Anzeige der Daten meiner DIY Wetterstation aus dem Projekt Airrohr https://sensor.community/de/ auf einem ePaper Display. Alle 10min wird das Display aufgeweckt und zeigt mir neben Temperatur und Luftdruck auch noch die aktuellen Feinstaubwerte an. Danach geht es wieder in den Ruhemodus. Vorteil bei ePaper: Die Anzeige bleibt erhalten. Jetzt geht es ans Layout.
#airrohr #maker

DAILY AIR QUALITY UPDATE
#Feinstaub in #Cannstatt / #Stuttgart (20.03.2025 20:06 CET)
PM10: 7.3 µg/m³
PM2.5: 5.4 µg/m³
Details: https://maps.sensor.community/#15/48.8040/9.2280
This is a bot. Code is available on github aschuma/air_tweets.
#Luftverschmutzung #Particulatematter #Opendata #Civictech #Airrohr #Airpollution #Airquality
DAILY AIR QUALITY UPDATE
#Feinstaub in #Cannstatt / #Stuttgart (19.03.2025 20:06 CET)
PM10: 22.3 µg/m³
PM2.5: 15.6 µg/m³
Details: https://maps.sensor.community/#15/48.8040/9.2280
This is a bot. Code is available on github aschuma/air_tweets.
#Luftverschmutzung #Particulatematter #Opendata #Civictech #Airrohr #Airpollution #Airquality
ExploreLive feeds
Mastodon is the best way to keep up with what's happening.
Follow anyone across the fediverse and see it all in chronological order. No algorithms, ads, or clickbait in sight.
Create accountLoginDrag & drop to upload